Clik here to view.

Blog posts with images get 94% more total views. Visual content attracts social media traffic. Moreover, visual content multiplies the chances of content being shared. There are a number of reasons to create visual content.
How to create great visual content (even if you are not a graphic designer)? This infographic shows you how.
Image may be NSFW.
Clik here to view.
Like it? Share it! Embed this infographic on your Website
Copy the code below:
Images , slideshows and videos that goes well with the topic of the post increases the chances of your post getting read by more people. 81 percent of people only skim the content they read online. Well placed visual content catches eye quickly increasing user engagement.
So, how to create visual content for topics that are not very visual? Here are the methods:
1. Eye catching, relevant photos
Note that relevance is important here. A random stock image of happy business people does not always work.
Here are some websites where you can download free high quality photos:
2. Explainer videos
Simplifying a complex subject is an awesome content strategy. Explainer videos does this well.
Here is an example of an awesome explainer video:
You can use tools like PowToon or moovly to create animated explainer videos.
Clik here to view.
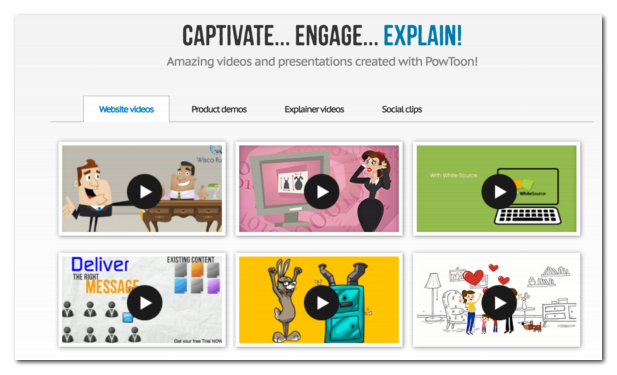
Powtoon is an online tool to create animated videos
3. Whiteboard videos
Whiteboard videos are another type of attractive video content where you explain a concept in simple, step by step manner. A well prepared whiteboard video can quickly become popular.
That video got more than fourteen million views!
With a little bit of practise, anyone can create Whiteboard videos like this. All you need is some imagination and some inspiration to explain the topic well. Here some of the tools that can make a good whiteboard video:
Clik here to view.
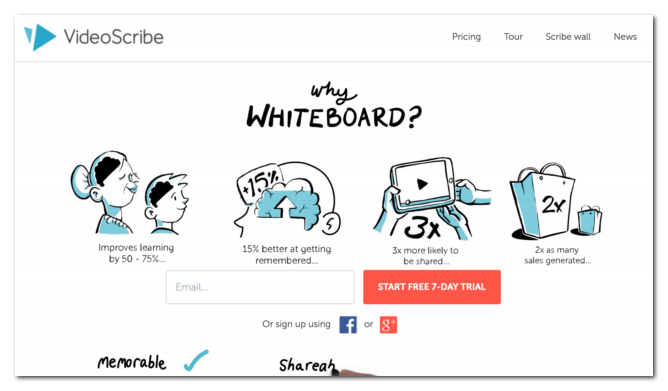
VideoScribe isa tool to make your own whiteboard videos
4. Screencasts
Screencast are great to demonstrate how to do a certain task. If there are tools that your audience use and the user interface is a bit complicated, Screen casts can be a real boon. Showing the steps to do the task works well in those cases.
Here is an example that shares some tips of using Microsoft Excel:
Here are the tools to build and share screencasts:
Clik here to view.

screencast-o-matic.com helps you record your screen and share the video
5. Screenshots
Screenshots of a software, web app or a webpage can work well when you are writing an educational or training style post.
Image may be NSFW.
Clik here to view.
(photo credit: Amit Agarwal)
Tools:
6. Infographics
Displaying data, statistics, facts and figures in an interesting and engaging way is what an infographic does.
Here are some of the online tools to make infographics:
Clik here to view.
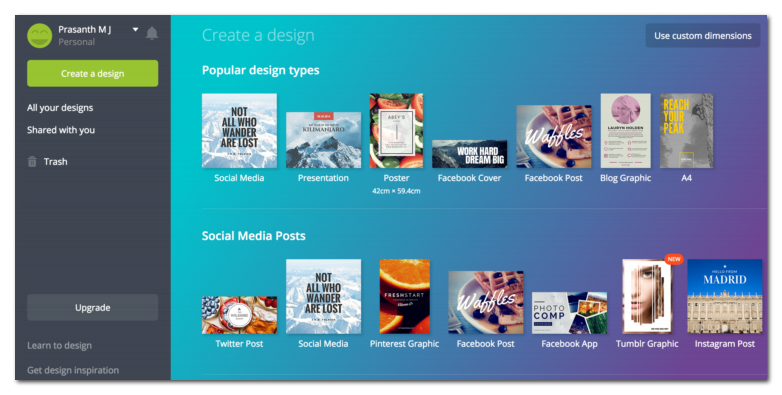
canva is an online tool to make images/infographics
7. Memes
Memes are fun and can become viral quickly. Social media loves memes. So why not include some fitting memes in your blog posts?
Image may be NSFW.
Clik here to view.
(image credit LazyBirdie)
Here are some online tools to make your own memes:
8. Interesting data visualization & statistics
Data without visualization can be difficult to understand. Complicated data is even impossible to understand without visualization.
Also, data is an excellent way to prove a point. When you make it visual, that makes the point even more convincing.
Image may be NSFW.
Clik here to view.
An example of data visualisation from What’s really warming the world
9.Cartoons
Cartoon is visual art form that has been in the mainstream media for a long time. When you see a cartoon, you know that there is something funny or satiric in it. So, that naturally attracts attention.
Image may be NSFW.
Clik here to view.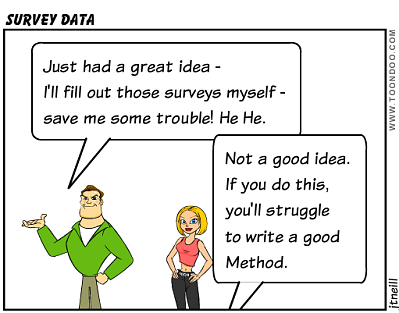
(image credit Jtneill)
Using tools like pixton or toondoo anyone can create cartoons. You just need to have a creative idea.
10. Inspiring Quotes
One type of content that gets shares fast, and one that is easy to add to any type of content is a quote. The quote can be from an inspiring speech by a great person (“Be the change you want to see” ), can be an exceptional observation or even an interesting research data (“81% readers only skim through online content”) .
Add a relevant image to the quote and you have a shareable “visual quote”.
Image may be NSFW.
Clik here to view.
(image credits: Celestine Chua)
Tool like Canva can be used to make a visual quote image.
11. Instructographics
When you demonstrate step by step with photos/images how to do something, that becomes an instructographics. Instructographics can be made for many types of topic like DIY projects, make up, recipes and more.
Instructographics is very effective compared to text-only instructions because it is visual and are followed by the corresponding photo/image.
Image may be NSFW.
Clik here to view.
Use tools like piktochart canva or venngage to create awesome instructographics.
In the present day web , it is impossible to get attention with text-only posts. Visual media is essential part of content. Hope the techniques outlined above helps you make your blog posts more visual.
References
- 37 Visual Content Marketing Statistics You Should Know in 2016
- Visual Content Strategy: The New ‘Black’ for Content Marketers
- 6 Types of Visual Content You Need to Use in Your Marketing Campaigns
- 5 Easy Ways To Introduce Visual Content Into Your Marketing Campaign – Forbes
- 5 Visual Marketing Trends That Will Dominate 2016
- Why You Need to Go Visual in Social Media in 2016
- A Picture Is Worth a Thousand Words: Visual Trends to Look For in 2016 – Inc Magazine